No time to read now?
-> Download the article as a handy pdf
List of contents
The Cost of Pharmacovigilance
Why legislation changes seem to be needed
Martti Ahtola | Oct 7, 2021

Pharmacovigilance (PV) is a growing industry. The increased spending on PV is caused by different factors, including among others: additional legislative requirements, move towards more complex medicinal products that are being approved under condition of additional monitoring, increased number of safety related data available, and last but not least, outsourcing of these increasingly complex activities to service providers incentivized by high invoices.
- What is the cost of the adverse drug reactions to the society due to hospitalization, missed workdays, death and other reasons?
- What is the cost of maintaining a PV system in the European Union?
- What portion of their budget marketing authorisation holders (MAH) should reserve on the maintenance of their PV system?
Summary
Cost of PV is increasing without clear performance indicators. The current legislation forces both the authorities and the pharmaceutical companies to follow procedures that do not have clearly demonstrated impact in the safety of the drugs.
In order to curb unnecessary spending in pharmacovigilance activities, the processes need to be updated on legislative level. The implementation needs to be modernized by the authorities and the pharmaceutical industry needs to start demanding better service for their service fees, and require higher quality of their PV providers.
Company costs
The other side of pharmacovigilance activities funding (and the major one) is the internal cost centre of pharmaceutical companies. In addition to the service and annual fees to the authorities, the pharmaceutical companies pay for their own pharmacovigilance activities to ensure compliance with the law. This means hiring and managing a pharmacovigilance department and purchasing and paying annual licences for specialized software, or outsourcing these responsibilities and paying a service provider company.
The pharmacovigilance costs of the company depend on how many products they have approved in the market, by how many people they are used and for what purpose. Some pharmacovigilance activities can be grouped together if the products are similar enough. This would include responsibility roles such as EU QPPV, Local Contact Person for Pharmacovigilance, and the overall maintenance of the global PV system including legally required documents that describe it (PSMF). Other activities need to be done product by product: marketing authorization applications, transfers and variations, periodic safety update reports, risk management plans and risk minimization measures, literature monitoring, signal detection etc.
The cost of activities such as ICSR / ADR case processing, product quality complaints and medical information, is determined both by the number of the products and the type of the products. If the product is commonly used (for example paracetamol), it can be expected that there are large number of adverse event reports to handle, even when the product is known to be relatively safe. Another situation are products that are used for serious conditions where the patients’ condition is constantly worsening either for an extended time period (MS, Parkinson’s) or the end result is often the death of the patient (oncology). Even if the number of the patients is relatively low, the amount and the seriousness of the adverse events is high.
Quality costs
From the perspective of a service provider company, the cost of a service or a product is always an important aspect when discussing pharmacovigilance processes with the clients and at least on high level the same applies internally in the pharmaceutical companies. How can we achieve the best possible quality with the lowest possible price? The average tender puts five or so service provider companies in a competition. The companies all have similar capabilities, selling points and proposals to solve the client’s problems (at least that was true before Tepsivo arrived).
In a traditional view, there is no upper limit to the quality of the service. You can always add a new process or an additional round of review or risk assessment step to reduce the likelihood of errors and to ensure that you can drown the inspectors in piles of trackers and reports to evidence that you have all angles covered. This is the standard CAPA answer following an audit or inspection.
However, that is not what quality is when it comes to pharmacovigilance.
It is a legislative requirement and quality should be measured by the capability to comply with the law in 100%, and achieving it with the most efficient processes, in time and costs.
All things being very much intertwined; light, automated, processes are much more likely to avoid human errors while providing complete transparent oversight and inspection-readiness, all the while requiring substantially lower human effort, further minimizing mistakes, and overall reducing total costs. With the right process, the lowest-cost solution with the lightest SOPs and minimum people required may in fact be the highest quality solution.
Quality costs are an intrinsic part of measuring quality itself, not only to satisfy the CFO.
Money is the reason why we have the current pharmacovigilance legislation
As we wrote in background of the current pharmacovigilance legislation, when the EU legislation went through its latest major update in 2008, the goal of the amendments was not only to protect the patients but also to reduce the financial impact of the adverse drug reactions (ADR) on the society.
In 2008, European Commission estimated that the ADR-related costs other than those caused by hospitalization are at €63.2 billion annually in the EU and that the total societal cost of ADRs in the EU was €79 billion.
As a side note: No reference was provided to these two figures and our research into the topic found no statistics that supports these estimates.
The idea of the new pharmacovigilance requirements was that hospitalization and death cause more burden on the society than stringent monitoring and reporting of the adverse drug reactions. If this were true, the pharmacovigilance activities would create value by reducing the healthcare costs elsewhere.
It was estimated that preventable ADRs cost €23 billion annually causing 200,000 deaths and the new legislation could achieve the savings of €237 million to €2.37 billion and prevent 591 – 5,910 deaths annually. However, our research showed that estimated number of deaths is not supported by the national statistics collected by Eurostat, there has been no decrease in the number of deaths caused by ADRs since 2010 and no information about possible savings in healthcare costs have been published by the European Commission or the EMA since the implementation of the current EU PV legislation.
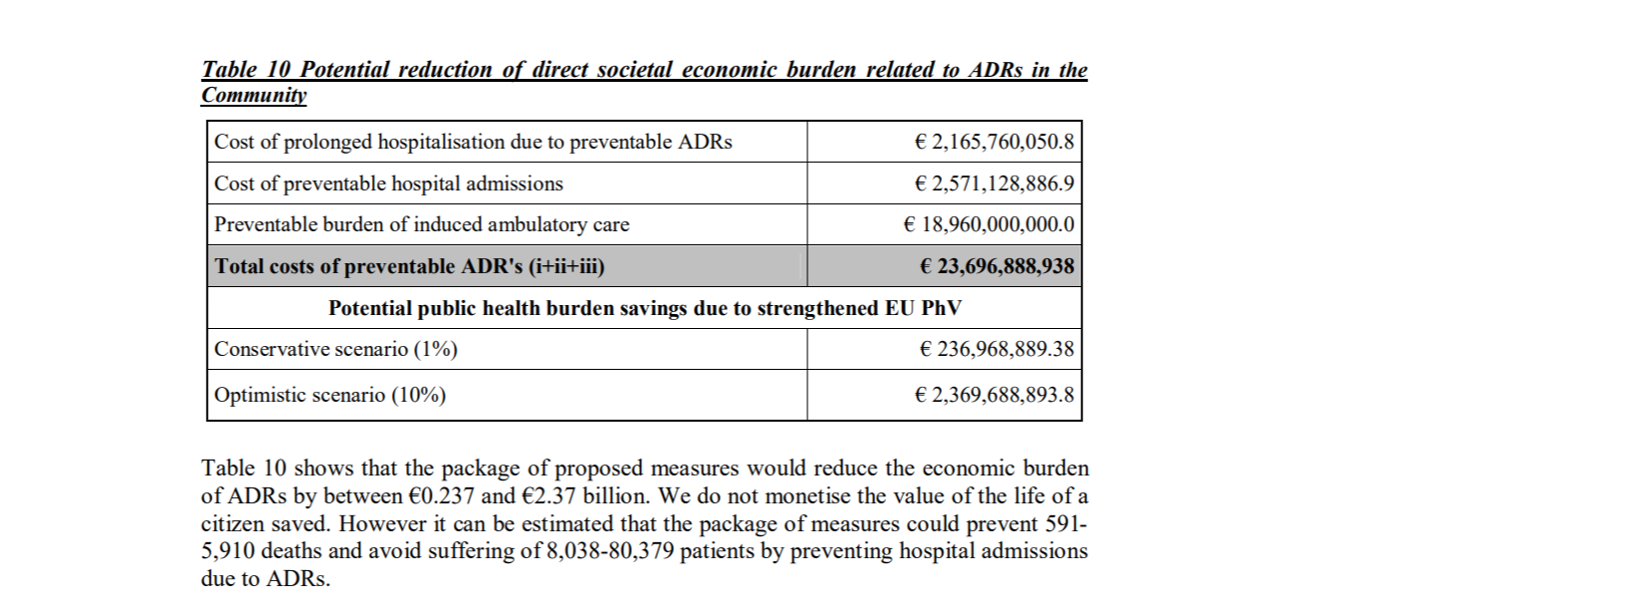
European Commission estimation of the savings with the new PV legislation [i]
Funny detail that we stumbled upon during our research was a memo presented to the European Commission in 2008 which stated that the update of the legislation “will help to cut red tape by decreasing the administrative burden by ca. € 145 billion p.a.” However, the actual estimated decrease to admin burden was € 145 million. Who knows, maybe it was this memo that sealed the deal with the decision makers.
EMA administrative costs
Since the introduction of the pharmacovigilance legislation and Good Pharmacovigilance Practices (GVP) guidelines in 2010-2012, the annual budget of the EMA has doubled from €174 million to €358 million[ii].
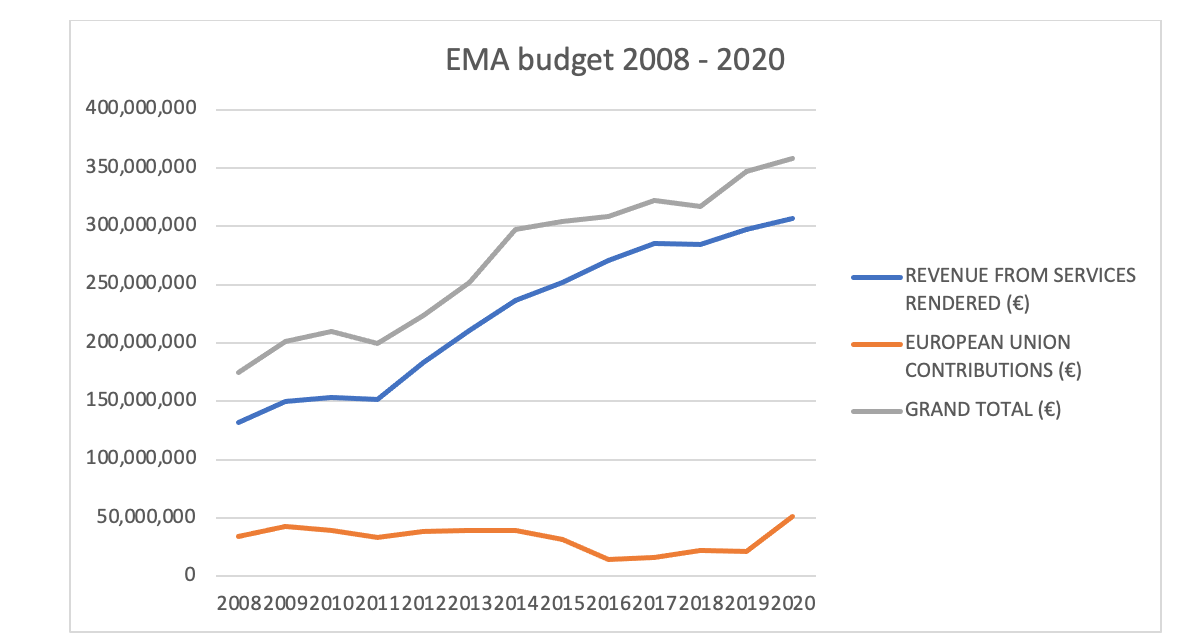
EMA annual budget 2008-2020
The budget graph also shows that the contribution by the Member State governments has remained roughly the same while the revenue from services rendered has more than doubled. The increase in the costs for the pharmaceutical industry was quickly noticed by the industry and the umbrella organization EFPIA tried to start a dialogue with the authorities as early as 2014.
On average, the total pharmaceutical expenditure per capita in the EU has remained the same between 2008[iii] and 2018[iv] and the healthcare expenditure as share of the GDP has also remained on the same level.
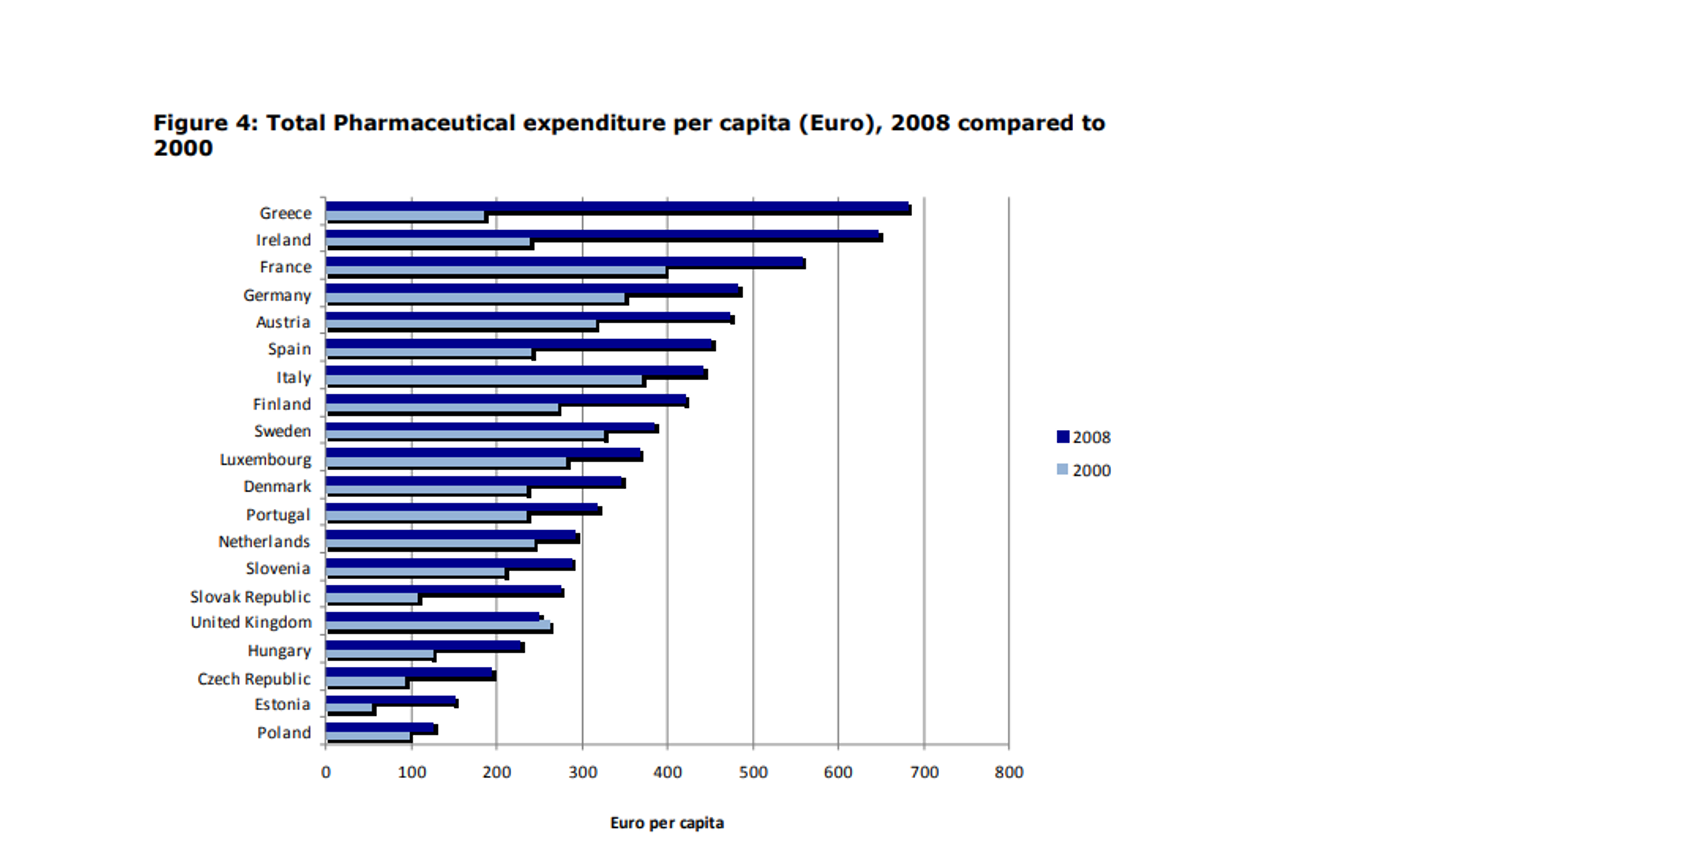
Total pharmaceutical expenditure in 2008
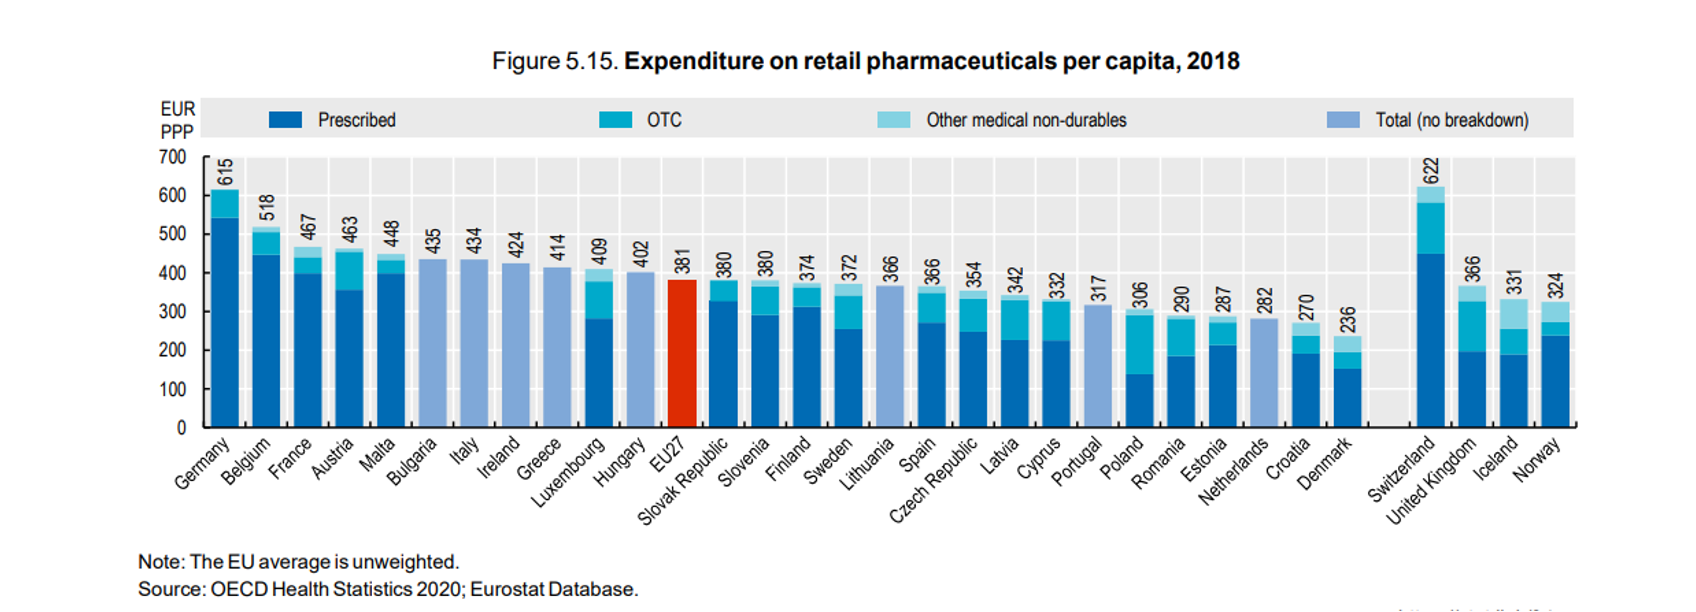
Total pharmaceutical expenditure in 2018
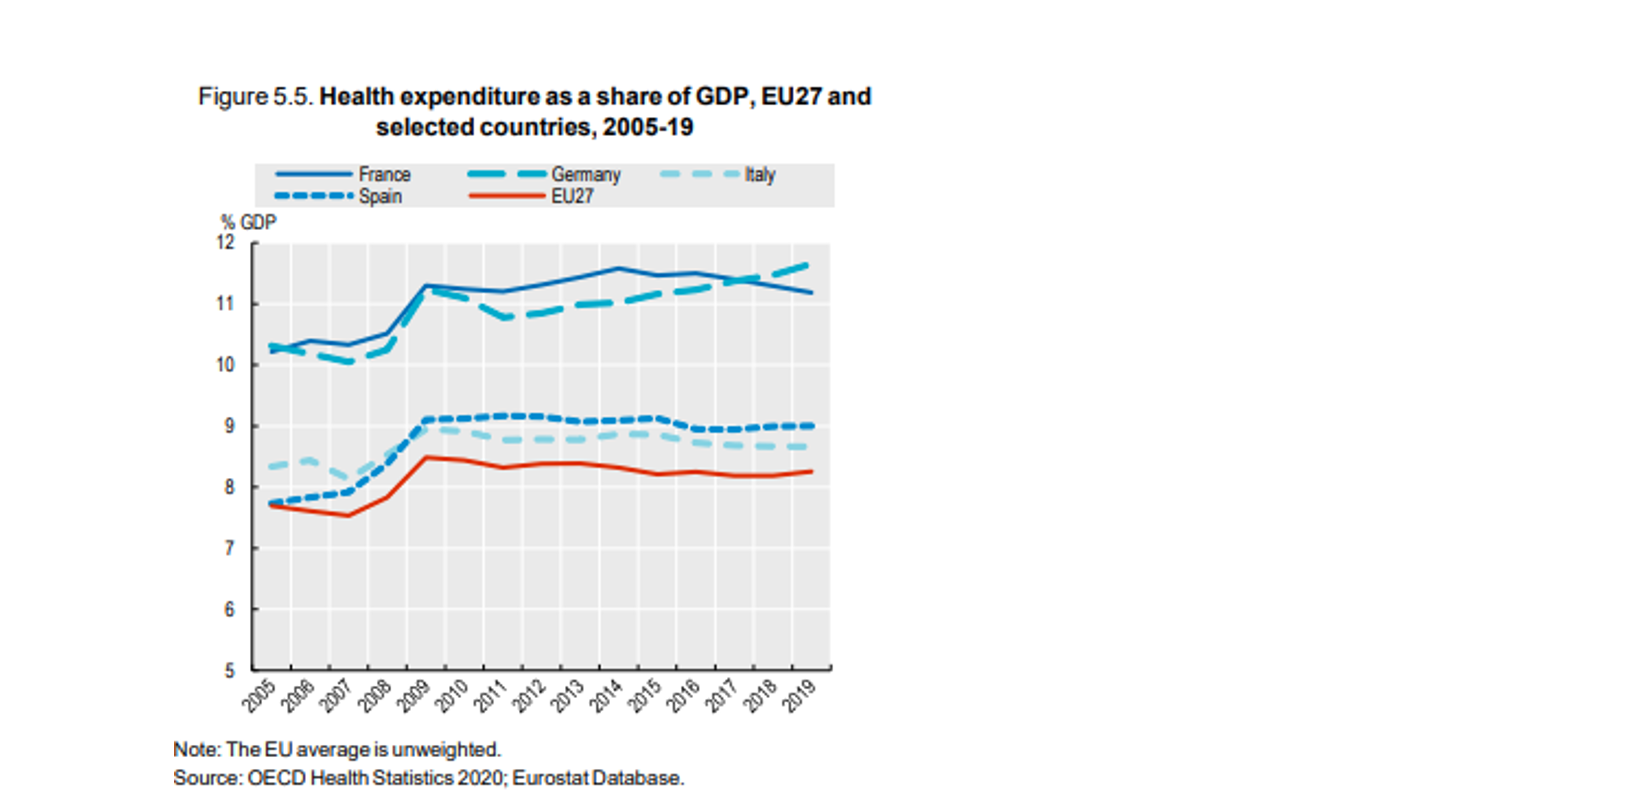
Healthcare expenditure as share of the GDP
Cost of pharmacovigilance to the pharmaceutical industry
It would be very interesting to see how the cost of pharmacovigilance activities among pharmaceutical companies has changed since 2008 and especially since 2012 when the EU legislations came into force. The new legislation and service fees caused concerns within the industry from the beginning and there were some early reports about pharmaceutical industry’s dissatisfaction with the increased costs.
It is easy to understand that the industry was unhappy around 2014 just by looking at the doubled fees paid to the EMA.
There are no exact figures available but some estimates say that the industry will grow to $15 billion by 2028. The same report estimates that the size of the global pharmacovigilance and drug safety software market size is expected to be $207.7 million by 2024. We believe the latter figure is a gross underestimation based on the pricing models that most of the pharmacovigilance safety database vendors use and the number of ICSRs reported globally.
Whatever the exact figures are, there seems to be a consensus on one thing, the costs of pharmacovigilance for the pharmaceutical companies are going up. And that is fine, as long as we can see that the financial and human costs caused by the ADRs through hospitalization and sick days are going down.
Performance monitoring and impact assessment
For the authorities, agencies, and ministries of health, it would be great to see clear objectives and measured performance against those objectives. That performance should not reflect only the timeliness of cases processed or the processing time of a marketing authorization application, but the key performance indicators should also be tied to the real-world data on the impact of pharmacovigilance: the number of reported adverse events, number of hospitalizations due to adverse events and number of deaths caused by ADRs.
With the current legal requirements, EMA’s approach, and standardized traditional business model among PV providers, it is almost impossible to measure the cost-effectiveness of pharmacovigilance activities. And that needs to change.
For pharmaceutical companies, additional transparency on the costs of the legally required activities would not hurt either. It would make it clearer what should the actual costs of performing these activities be. In the current situation, there are far too many companies performing far too many activities that they do not have to perform, and companies paying for unnecessary services that increase their pharmacovigilance budget without producing any additional information about the benefit-risk profile of the medicinal product.
A good move to this direction of transparency is already starting to happen in Italy where the authorities are forcing the pharmaceutical companies to disclose details about the funding and profits of their drugs to receive reimbursement.
Transparency is required from both parties to ensure that pharmacovigilance activities produce the value that it is designed to create.
References
[i] Commission Staff Working Document https://www.europarl.europa.eu/RegData/docs_autres_institutions/commission_europeenne/sec/2008/2671/COM_SEC(2008)2671_EN.pdf
[ii]
- Budget 2020, EMA, https://www.ema.europa.eu/en/documents/report/european-medicines-agency-budget-2020_en.pdf
- Budget 2017, EMA, https://www.ema.europa.eu/en/documents/report/european-medicines-agency-budget-2017_en.pdf
- Budget 2014, EMA, https://www.ema.europa.eu/en/documents/report/european-medicines-agency-budget-2014_en.pdf
- Budget 2011, EMA, https://www.ema.europa.eu/en/documents/report/report-budgetary-financial-management-financial-year-2011_en.pdf
- Budget 2009, EMA, https://www.ema.europa.eu/en/documents/report/annual-accounts-financial-year-2009_en.pdf
[iii] Differences in Costs of and Access to Pharmaceutical Products in the EU, European Parliament, 2011, https://www.europarl.europa.eu/document/activities/cont/201201/20120130ATT36575/20120130ATT36575EN.pdf
[iv] Health at Glance: Europe 2020, OECD and European Commission, 2020, https://ec.europa.eu/health/sites/health/files/state/docs/2020_healthatglance_rep_en.pdf
Did you like the article? Share with your network!
…or tell us your opinion.

Follow our newsletter!
Keep up with industry trends and get interesting reads like this one 1x per month into your inbox.
Learn more about Tepsivo
We deliver modern PV solutions to fulfill your regulatory needs using less resources. See how we do it >

0 Comments